MTBF vs. MTTR: 3 Big Differences You Should Know

Imagine your team has a sudden stop that makes work pause and loses a lot of money every hour. You often hear about MTFB vs. MTTR when talking about how well systems work. These two metrics show how often machines break and how fast you can fix them.
Unplanned downtime costs large companies about $1.5 trillion each year.
Factories lose 27 hours of work every month because of various problems.
A higher MTFB means machines work better and cost less. A lower MTTR means you fix things faster and lose less time.
MTBF vs. MTTR Overview

What Is Mean Time Between Failures (MTBF)?
Mean time between failures tells you how long a system works before it stops. MTBF shows the average time between one breakdown and the next in systems you can fix. This metric helps you know if your system is reliable and helps you plan for fewer stops. In factories, MTBF helps you guess how long machines will run before repairs are needed. In software, MTBF helps you see if your apps are stable and when you might need updates.
Term | Definition |
|---|---|
MTBF | The mean time between two failures in systems you can repair, found by adding MTTF and MTTR. |
To find MTBF, divide the total time the machine works by the number of times it fails. For example, if a machine works for 2,080 hours and breaks 4 times, the MTBF is 520 hours. Some industries, like aerospace, have MTBF values between 5,000 and 10,000 hours. In IT and telecom, MTBF is usually between 500 and 2,000 hours.
What Is Mean Time to Repair (MTTR)?
Mean time to repair tells you how long it takes to fix something after it breaks. MTTR measures the average time from when a failure happens until the system works again. You use MTTR to see how well you fix things and how fast you recover. In factories, MTTR helps you know how quickly machines can work again. In software, MTTR shows how fast your team can fix problems or get services back.
Term | Definition |
|---|---|
MTTR | The average time it takes to fix a system after it breaks. |
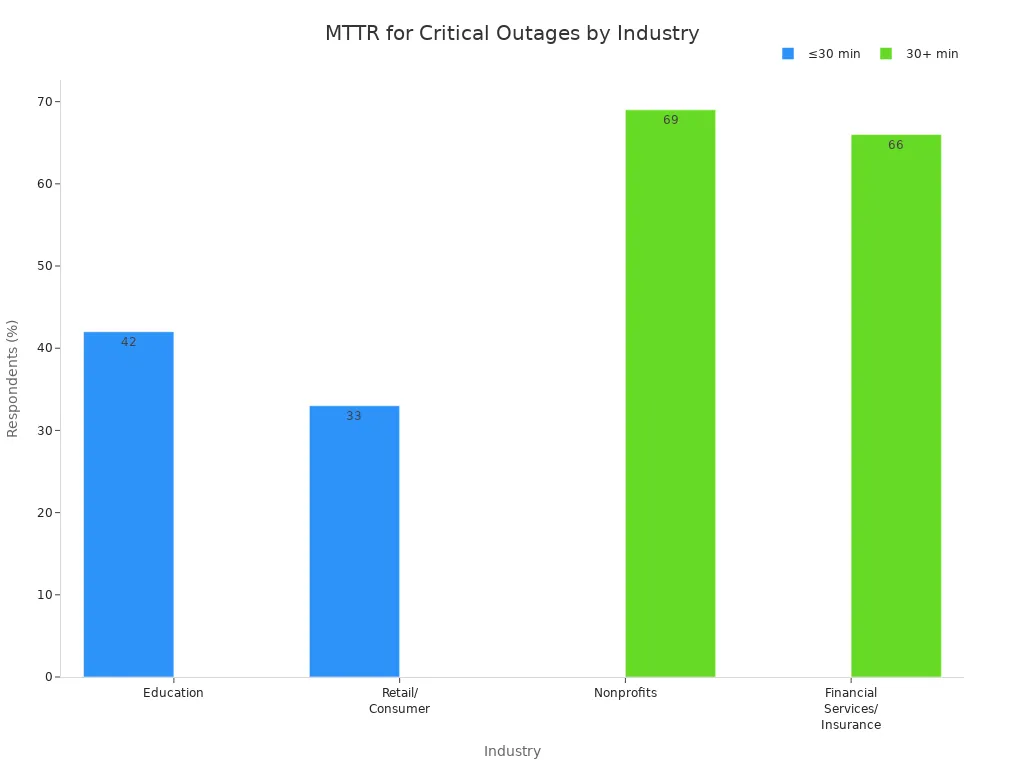
To find MTTR, divide the total time the system is down by the number of repairs. For example, if your system is down for 100 minutes over 5 failures, the MTTR is 20 minutes. In some places, like schools or stores, teams try to keep MTTR at 30 minutes or less.
Why These Metrics Matter
You need both MTBF and MTTR to keep your systems working well. MTBF helps you plan when to do maintenance and avoid surprise stops. MTTR helps you see how fast you can fix things and make repairs better. If you track both, you can notice patterns, plan maintenance, and make smart choices for your team. High MTBF means fewer breakdowns and more time working. Low MTTR means less time stopped and faster fixes. These metrics help you make your systems more reliable, keep them running longer, and make your work smoother.
Metric | Implication for Maintenance Planning |
|---|---|
MTBF | High MTBF lets you plan maintenance ahead of time, so you have fewer surprise breakdowns and lower costs. |
MTTR | Low MTTR means you spend less time fixing things and get better at repairs, so you need to plan maintenance before problems happen. |
Tip: Automated monitoring tools now help you track MTBF and MTTR as things happen, so you can fix problems faster and make your systems work better.
Key Differences
What They Measure
When you look at mtbf and mttr, each one tells you something different. MTBF shows how long your system works before it stops. MTTR tells you how fast you fix things and get your system running again. MTBF helps you see how reliable your system is and how much time it works. MTTR helps you see how much time your system is down and how well you fix problems.
Here is a table that shows what each metric focuses on:
Metric | Definition | Focus |
|---|---|---|
MTTR | Measures the time needed to fix failures | Repair efficiency |
MTBF | Tracks the time between failures | System reliability |
If you want to know if your system is reliable, look at mtbf. If you want to fix things faster, focus on mttr. Both metrics help you learn about system failures and make better choices for maintenance.
How They’re Calculated
To find mtbf, divide the total time your system works by the number of times it fails. For example, if your system works for 2,000 hours and fails 4 times, mtbf is 500 hours. This tells you how long your system works before it fails again.
To find mttr, divide the total time your system is down by the number of repairs. If your system is down for 100 minutes over 5 failures, mttr is 20 minutes. This shows how fast you fix things and get your system working again.
You need good data to get the right results. Bad records can make mtbf wrong. Changes in heat or moisture can also change your numbers. If you change how you do maintenance, mtbf can go up or down. You need to keep checking your data to get the best results.
Tip: Always look at your data before you figure out mtbf or mttr. Good records help you find real problems and make your system work better.
Common mistakes when calculating:
Bad failure data or missing records can make mtbf wrong.
Changes in heat or moisture can make mtbf less correct.
Doing maintenance too often or not enough can change mtbf.
Operational Impact
MTBF and MTTR help you make choices every day. When you track mtbf, you can plan maintenance before things break. This helps you avoid surprise downtime and keeps your system working well. MTTR helps you see where you need to fix your repair process. If mttr is high, your system stays down longer. If you lower mttr, you fix things faster and lose less time.
MTBF helps you plan when to do maintenance. You know when things might break, so you can act before downtime starts.
MTTR shows how fast you fix things. You can find weak spots in your repair process and make changes to work better.
When you use both mtbf and mttr, you make smart choices. You can plan maintenance, cut downtime, and make your system more reliable.
If you want your system to work longer and break less, watch mtbf. If you want to fix things faster and spend less time stopped, improve mttr. These metrics help you build a good maintenance plan and keep your system working well.
MTBF and MTTR Use Cases
When to Use MTBF
You use mtbf when you want to guess when things might break. MTBF helps you see if your system is reliable and how often it might stop. In factories, you can count how many times a robot line breaks each year. This helps you plan when to fix things so you do not get surprised by breakdowns. It also keeps work going. In hospitals, you use mtbf to check if MRI machines are reliable. You want to know when they might stop working so you can plan repairs and keep patients safe.
MTBF helps you plan money for repairs. You can make a budget for fixing things and try to have less downtime.
You use mtbf to lower risks. In important jobs, you find machines that break a lot and plan to fix them before they fail.
MTBF lets you make a repair schedule. You can fix small problems before they turn into big ones.
Tip: Figure out mtbf for your machines, find the average time between failures, and plan to fix things before they break again.
When to Use MTTR
You use mttr when you want to fix things faster and have less downtime. MTTR shows how quickly you repair things and get them working again. In factories, you watch how long it takes to fix machines so work does not stop. In building management, you check how fast you fix elevators or air systems. In IT, you see how quickly you fix computers or programs after they break.
Industry | Use Case Description |
|---|---|
Manufacturing | Watch repair times for machines to keep work smooth. |
Facility management | Check how fast you fix things like elevators or air systems. |
IT systems | See how well you fix computers or programs. |
MTTR helps you find where your repair process is slow. By looking at mttr, you can spot weak areas and make changes to fix things faster. Lowering mttr helps your team work better and keeps systems running more.
Using Both Together
You get the best results when you use mtbf and mttr at the same time. Watching both helps you see patterns in breakdowns and repairs. You can tell if quick fixes cause more problems or if long repairs mean bigger issues. Add notes from workers and look at what caused the problem. This gives you a better idea of how reliable your system is and helps you plan repairs.
Look at mtbf and mttr over time, not just once.
Connect your repair data to work, quality, and safety records.
Use tools to watch both numbers and make smart choices.
Note: Using mtbf and mttr together helps you make your system stronger, cut downtime, and work better. You can make a good repair plan and keep your system working longer.
You can find three main ways MTBF and MTTR are different in the table below. MTBF tells you how long your system works before it fails. MTTR tells you how fast you fix a failure and get things running again.
Metric | Definition | Implications |
|---|---|---|
MTBF | Average time between two failures in a system. | Shows reliability and performance. |
MTTR | Average time spent fixing a failure in a system. | Shows repair efficiency. |
If you want your system to be more reliable, look at MTBF. If you want to fix things faster, watch MTTR. Pick the metric that fits what your system needs most. Check your system’s failure logs, teach your team new skills, and use sensors to spot problems early. Share what you learn so everyone can help make the system better.
FAQ
What is incident response in relation to MTBF and MTTR?
Incident response means acting fast when things break. MTBF helps you guess when problems might happen. MTTR shows how quickly you fix things during incident response. If you track both, you can make your team fix things faster.
How does incident response help lower MTTR?
You teach your team how to handle problems. You make simple steps for fixing things. You use tools to find issues quickly. After each problem, you look for ways to fix things faster next time.
Why should you track incident response times?
Tracking incident response times shows how long it takes to fix things. You can see where your team is slow. You find weak spots and make your process better. This helps you lower downtime and improve your response.
Can incident response improve system reliability?
Incident response helps you fix problems before they get worse. You stop small issues from becoming big ones. This keeps your system working longer. You check each response to find patterns and make your system stronger.
How do you use incident response data with MTBF and MTTR?
You write down what happens every time something breaks. You look at MTBF and MTTR numbers together. You see how your system handles problems. This helps you plan better and make your system work better.
See Also
A Simple Explanation of Total Productive Maintenance Concepts
Understanding Measurement System Analysis for Quality Assurance
The Meaning of TIMWOOD in Lean Manufacturing Practices
The Role of PPM in IATF 16949 Certification Explained
The Importance of SMED in Modern Lean Manufacturing
About Hunan Puka

Established in 2016 and based in Hunan, China, with a liaison point in Berlin, we are a Tier 2 supplier for the automobile industry. We specialize in the production of customized aluminum die-casting parts designed for machines with a closing force ranging from 280 to 1250 tons, with subsequent manufacturing process CNC machining and surface treatment. Our commitment to quality is reflected in our accredited quality management system, certified by ISO9001:2015 and IATF16949:2016 standards.